The Pennsylvania Court Dockets Experiment-Part II
Andrew Wilmot MD · October 21, 2026 at 8:52 AM ET · edited
The Pennsylvania Court Dockets Experiment-Part II
Introduction
The quality of data on medical malpractice is limited by many factors, one of which is the tendency to report figures as national averages. Take for instance the AMA’s April 2026 report on medical liability claim frequency among US physicians. The report concludes that as of 2024, the proportion of physicians that were sued over their career was 28.7%, down from 31.2% in 2022. While this may be an encouraging national trend, what about the states where medical liability claim frequency is increasing? Providing only national figures may in a sense provide cover for the counties and states where medical malpractice runs most rampant. In fairness, the AMA report does contain a chart breaking down the data into nine census divisions, with the Middle Atlantic data showing 3.4% of doctors had been sued in the past year, compared to 1.8% nationally. Nonetheless, combining data from any other state is likely to provide false reassurance about the current predicament facing doctors in Pennsylvania.
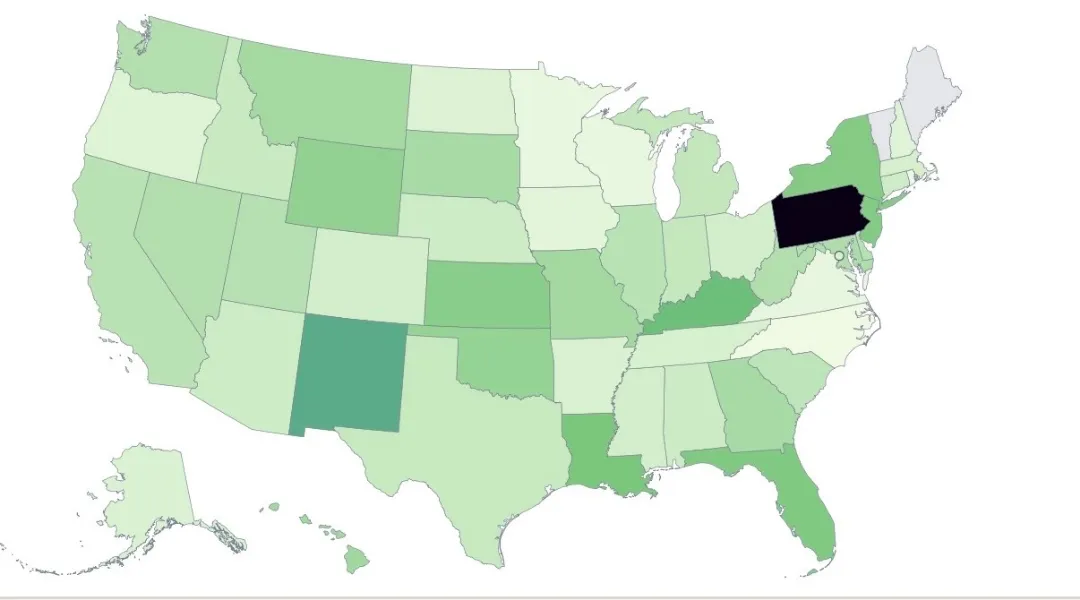
Based on NPDB data through the first quarter of 2026, the frequency is Pennsylvania is 31.6 payments per 1,000 physicians. This is almost three times as high as the next highest state, New Mexico, where the payment frequency is 10.8 per 1,000 physicians. It is also approximately 10 times higher than the 30th highest state, Arizona, and approximately 40 times higher than the 50th ranked state, North Carolina. Whether these figures will change over the course of 2026 will be interesting to monitor, but I think it is safe to say that when the rate of payments varies 40-fold amongst states, reports on national trends provide little comfort to doctors practicing in Pennsylvania.
The US Chamber of Commerce Institute for Legal Reform released a 2024 report on Tort Costs in America broken down by state. The report includes the following table. The table ranks states based upon tort costs as % of GDP, from highest to lowest. Pennsylvania ranks 14th on this list. The current quality of the discourse on medical malpractice is such that the PA court system would likely cite this as evidence that medical malpractice in Pennsylvania is not a problem.
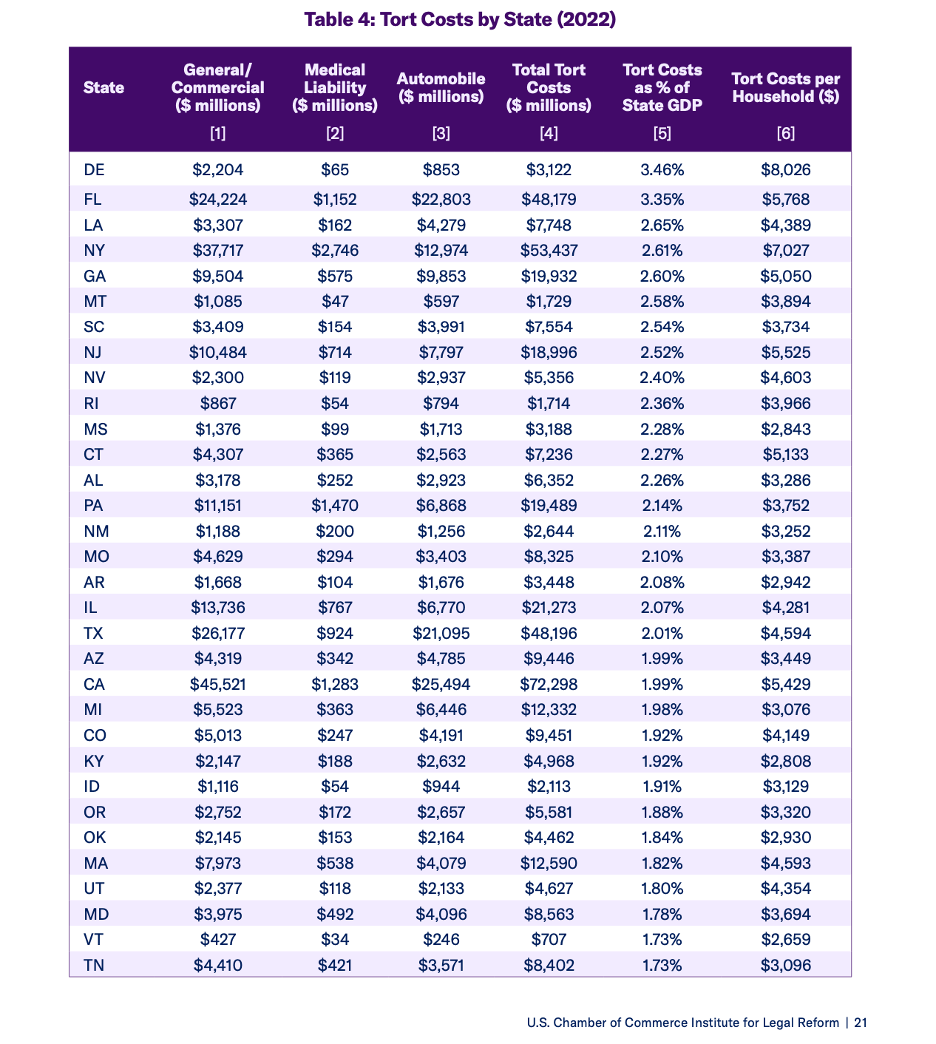
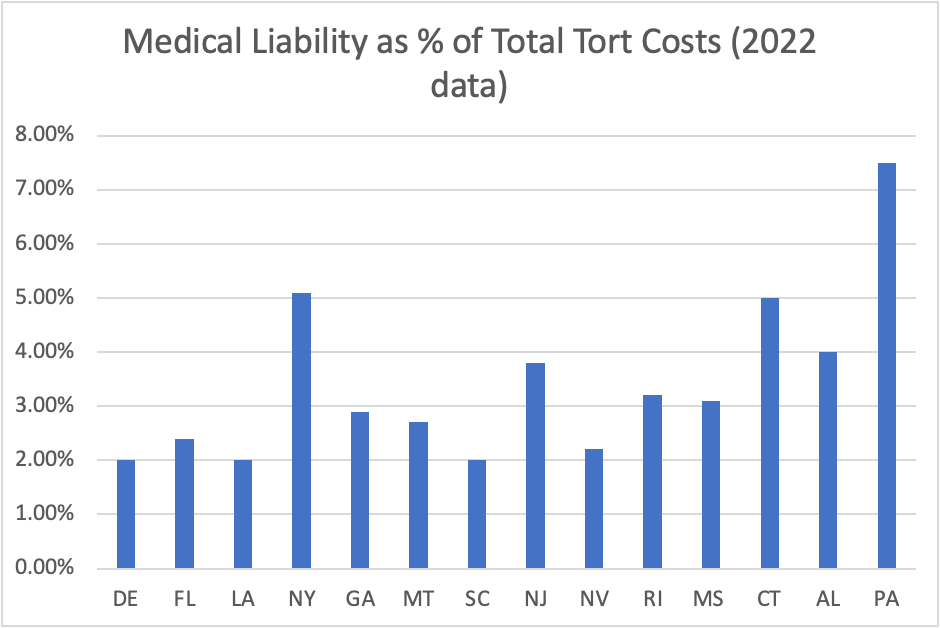
However, when measuring Medical Liability as a percentage of total tort costs per state, a very different pattern emerges. Table 2 includes the top 14 states in terms of tort cost as % of GDP. In Pennsylvania, the medical liability as % of Total Tort measures approximately 7.5%. New York and Connecticut are next highest at about 5%, and the majority of these tort heavy states show figures of 2 to 3%. The figure for Pennsylvania is more than twice that of all but three of the other top 14 states. Analysis of the US Commerce data from 2020 demonstrates a similar pattern.
Clearly, Pennsylvania is a significant outlier when it comes to medical malpractice activity. I have set out to analyze the data on malpractice in Pennsylvania in a more detailed manner than that available through existing sources. As I have stated previously, the NPDB only reports malpractice payments and ignores the substantial percentage of doctors who are dragged through the litigation process without ever paying a claim. It is a disservice to these doctors (as well as the hospitals they work for and the patients they treat) to assume that their experience is inconsequential. The AMA calculates the rate at which doctors are sued based on survey data. This is of course prone to both selection bias and reporting bias, considering the stigma attached to being sued as a doctor. Medical malpractice insurance providers also release information on medical malpractice trends, but again the data emphasizes national and regional trends and places less emphasis on local patterns. I would argue that the court system provides the least useful information of all when it comes to medical malpractice activity. In Pennsylvania, county court dockets from medical malpractice cases are not even submitted to the state, which severely limits the ability to analyze the data. States only report the number of medical malpractice lawsuits filed per year, and do not report on the total number of physicians sued (it is common for more than one doctor to be sued in a malpractice case).
The most useful information I have seen on medical malpractice risk is data from VRAD. In the CME lecture “137 years of Malpractice”, Benjamin Strong, MD, CMO of VRAD, reviewed all payment data from June 2017 through October 2020 and reported a relative risk of malpractice for all states where sufficient data was available. Pennsylvania accounted for 4.9% of study volume and 18.7% of payouts, equating to a Relative Risk of 3.8.
While the data from VRAD is praiseworthy, it still focuses only on claims resulting in payment. I would argue that doctors deserve to be informed about not just payment frequency but also claims frequency. Even in cases that result in no payment, the doctors named are still typically exposed to years of litigation, missed work, and a substantial psychological toll. Failing to address this issue risks continuing to alienate many doctors in perpetuity. While there are most certainly other factors which impact physician burnout, early retirement, and changes in practice scope and location, I suspect that medical malpractice concerns are a severely underrecognized source of these problems.
Therefore, I have set out to begin looking at total claims frequency against doctors, not based upon survey data, but rather upon review of court dockets. The failure of the courts to properly collect and analyze the court dockets is analogous to hospitals opting not to track data on hospital acquired infections, readmission rates, and mortality rates. I hope to be of assistance to the courts in establishing a means of subjecting medical malpractice data to appropriate scrutiny.
Data Collection and Analysis
I set out to answer the question what is the risk of being sued as a private practice radiologist in Pennsylvania? I was able to identify five radiology private practices which were in existence from 2004-2024, and which are located in counties where access to the court dockets is free. I chose to exclude any practice located in a county where court docket access was not free.
In my experience, the county court dockets are not particularly user friendly. For instance, I found that simply typing in the term ‘radiology’ did not provide reliable results. But through trial and error, I discovered that if I entered the exact name of a given radiology private practice in the appropriate county court docket search field, I was able to identify (presumably) all cases in which that practice was a named defendant. For each of the five private practices, I also searched for cases against the practice in the Philadelphia court dockets.
While I collected the data on each practice individually, for the time being I am choosing to report the data in an anonymized fashion without identifying the name or location of any of the groups. This is because revealing the identify of each individual practice and their malpractice data might theoretically have a negative impact on public perception and radiologist recruitment.
The total number of radiologists across the 5 private practices was approximately 140 in 2024. While there was most certainly some variability in that figure over the period of 2004 to 2024, it would be exceedingly difficult to determine the exact number in any given year. Furthermore the story of these practices is not one of linear growth; some of the practices have grown over time and others have contracted. Therefore, treating the total number of radiologists as 140 across the study period seemed a rational approach. If in fact the number of radiologists across the 5 practices was lower in 2004, then the malpractice risk in the early years of my analysis may be an underestimate; however, the data from more recent years would not be significantly impacted.
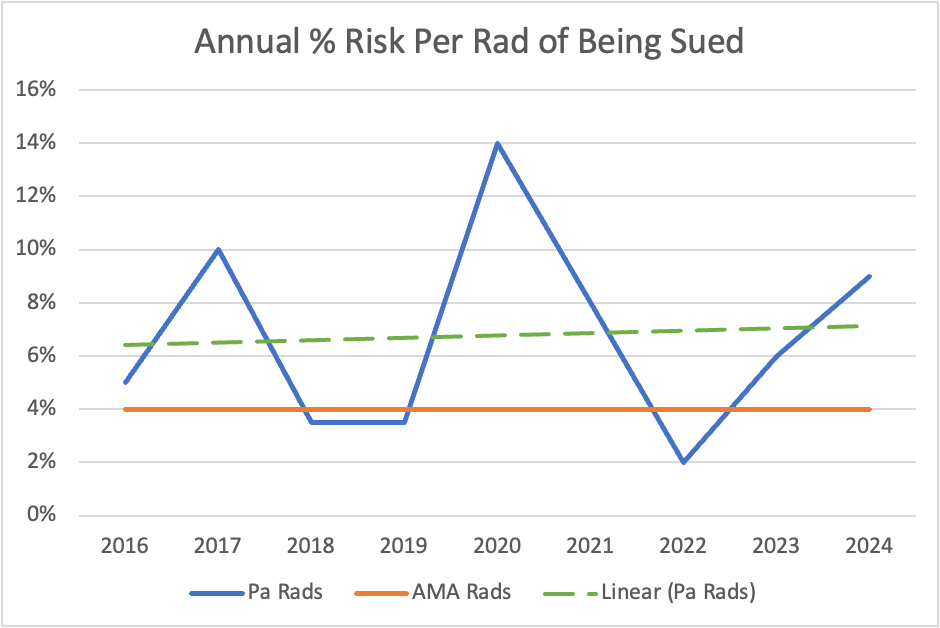
In the chart below, the red line represents the approximate rate at which radiologists are sued per year based on AMA survey data for 2024. The blue line represents the annual risk across the five radiology practices I analyzed, with a peak of 14% in 2020 and a 9% figure for 2024. The linear regression line in green reveals a risk of 6-7% in the early study period and a risk of 7-8% in recent years.
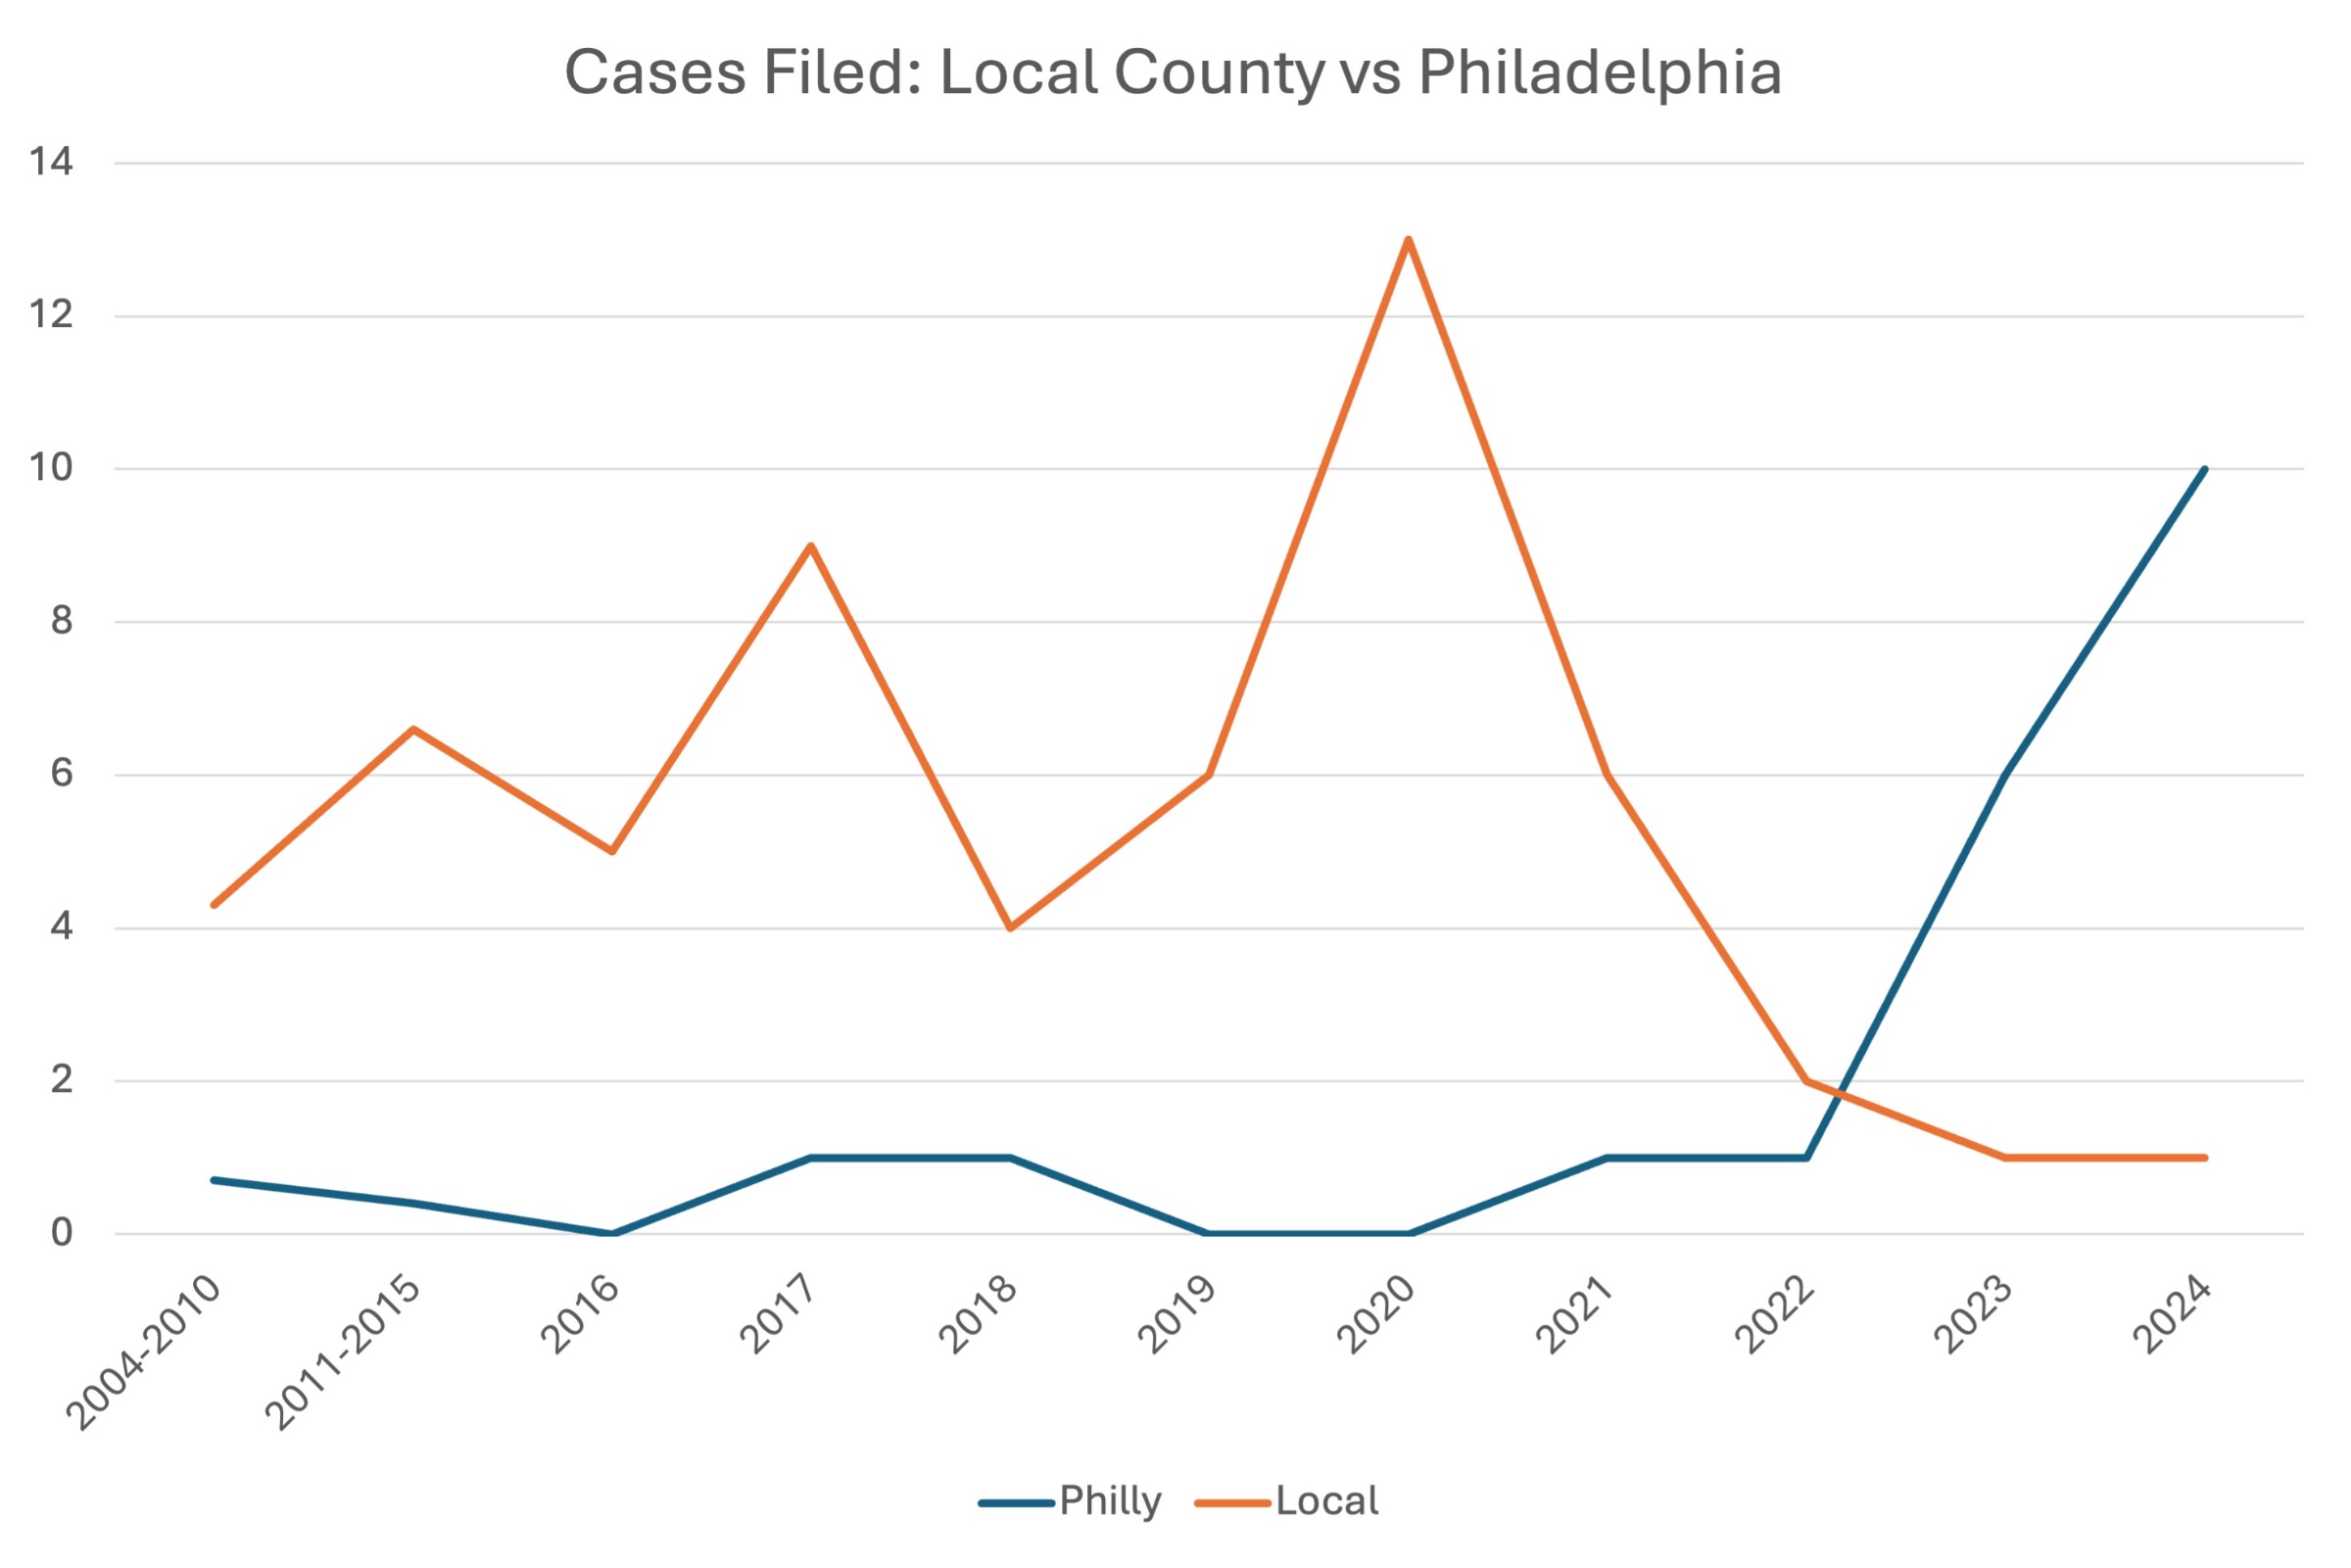
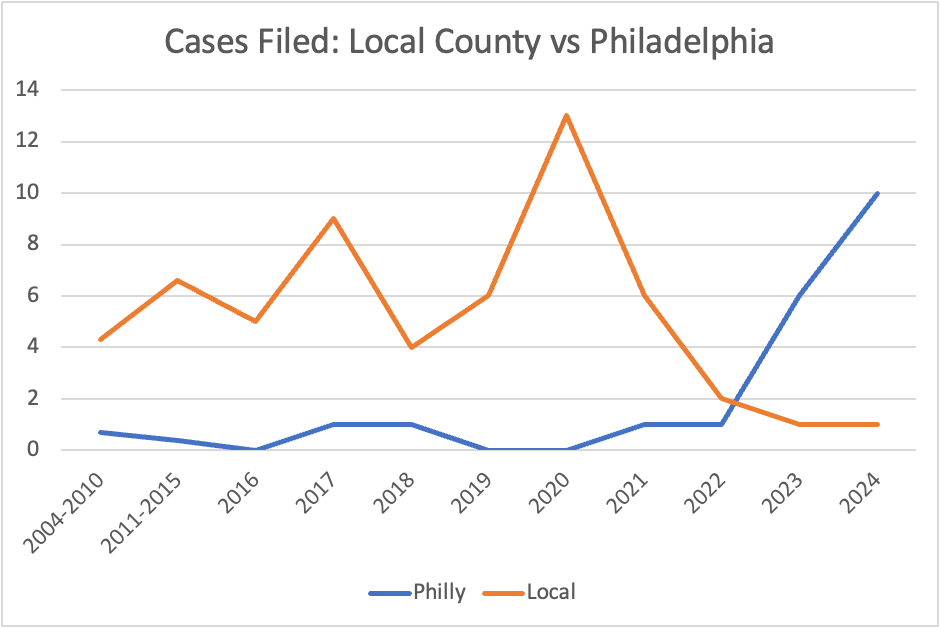
I also tracked the county in which malpractice claims were filed. In cases where the malpractice claim was filed both in the local and the Philadelphia court dockets, I counted the case only once and assigned it to the court with the most recent filing date. Below is a chart showing how the filing of cases in the local county versus Philadelphia changed over time. The venue rule change in 2023 resulted in a profound shift, with most cases prior to 2023 filed in local county courts and the majority of cases filed after 2023 filed in Philadelphia. Lawsuits against the five groups dipped in 2021-2022 and rebounded in 2023-2024. This may have been coincidental or related to the COVID pandemic, although it also seems plausible that the plaintiff’s attorneys strategically waited to file the claims until after the Venue Rule was rescinded on January 1, 2023.
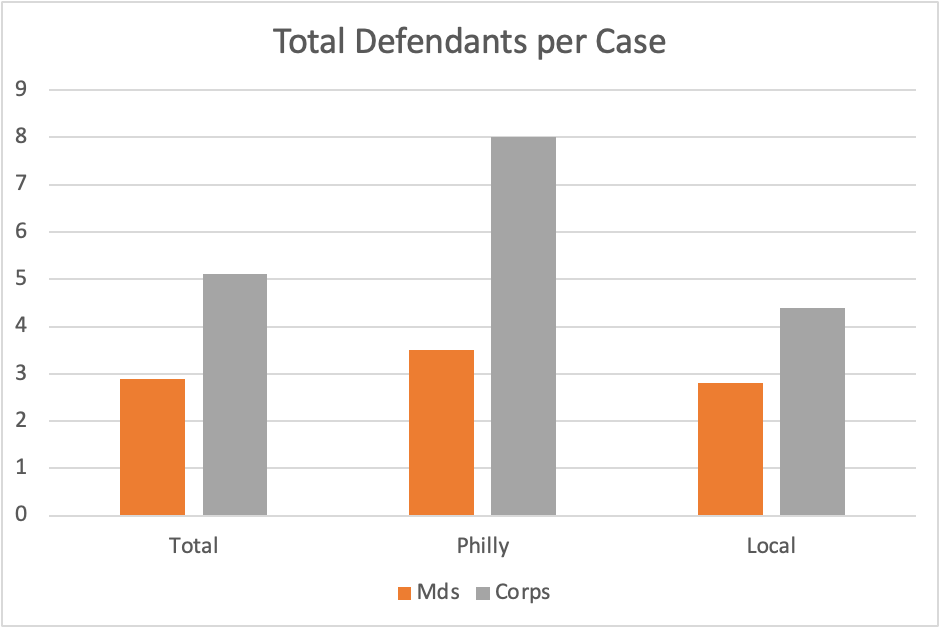
While reviewing each individual court docket, I recorded the total number of physicians named per case. I also recorded the total number of corporate entities named per case. Comparing the figures for cases filed in Philadelphia versus in the local courts, both the total number of doctors (3.5 v 2.8) and the total number of corporations (8.0 v 4.3) per filing were higher in Philadelphia.
Limitations and Future Directions
As indicated in the title of this article, the goal of this investigation was less about determining an exact risk of malpractice than it was about determining the plausibility of studying county court dockets as a method to more accurately track medical malpractice data and trends.
The annual risk of malpractice calculated for the five practices is well above the AMA’s reported national average, yet there are plenty of reasons why this may remain an underestimate. For one, I did not look into cases filed in federal court. There are also multiple reasons that I may have missed cases filed in the state court system. If the name of any of the radiology practices were misspelled in the court dockets, then these results would not show up. If any of the group members were sued individually without the group being named, these would also be overlooked. I limited my search to the county in which the radiology practice was located as well as Philadelphia. If cases against a given practice were filed in another neighboring county or anywhere else in the country, then these would not be included in the results. Lastly, it is not infrequent for cases to list physician defendants as ‘Jane Doe’ or ‘Jon Doe’ and it is often unclear exactly how many unnamed defendants there are in a case. Given the lack of clarity, I opted not to count unnamed defendants.
For all cases, the average number of named physician defendants was 2.9 per case. In my review of all malpractice claims in Allegheny County from 2021 as discussed in Part I, the figure was 1.8 per case.
The data from VRAD revealed a relative risk of 3.8 for Pennsylvania, while the data in this study reveals a relative risk of about 1.8 when compared to the national average reported by the AMA. These are of course different metrics. The VRAD data is based only on paid claims, which is consistent with how most data on malpractice is currently reported. The discrepancy could be a result of underestimating the actual risk of being sued for the radiologists across these five practices for the reasons described above. It may also be that compared to other states, the rate of payouts is higher in Pennsylvania.
The goal of this article was less about determining an exact malpractice risk for radiologists interpreting imaging for patients in Pennsylvania, and more about determining the feasibility of court docket review as a method of tracking malpractice data. While local court dockets are not particularly user friendly and the search engines vary from county to county, it is my belief that court docket review represents a promising method to more accurately track medical malpractice trends than those which we currently rely upon. With proper investment, this represents an opportunity to track medical malpractice data with integrity, recognize its impact on individuals and society, and to identify problematic geographic trends.